Introduction
If you are serious about analysing Bitcoin on-chain data, Glassnode insights is your holy grail.
Analysing on-chain data itself requires a lot of commitment and skills.
With Glassnode, access to the most important bitcoin on-chain parameters is much easier.
This article is about practical on-chain analysis using Glassnode.
I invite you to read!
About Glassnode Studio

Before I start describing the data available using Glassnode, I will mention something about the tool itself.
There is plenty to write about, because Glassnode Studio is a really great tool for analysing on-chain data from Bitcoin, Ethereum, Defi and many others. You will be able to find out more about it later in the article.
In the article itself, however, I will largely limit myself to bitcoin.
It’s time to stop beating around the bush and get to the point!
Bitcoin Metrics
Active Address Momentum
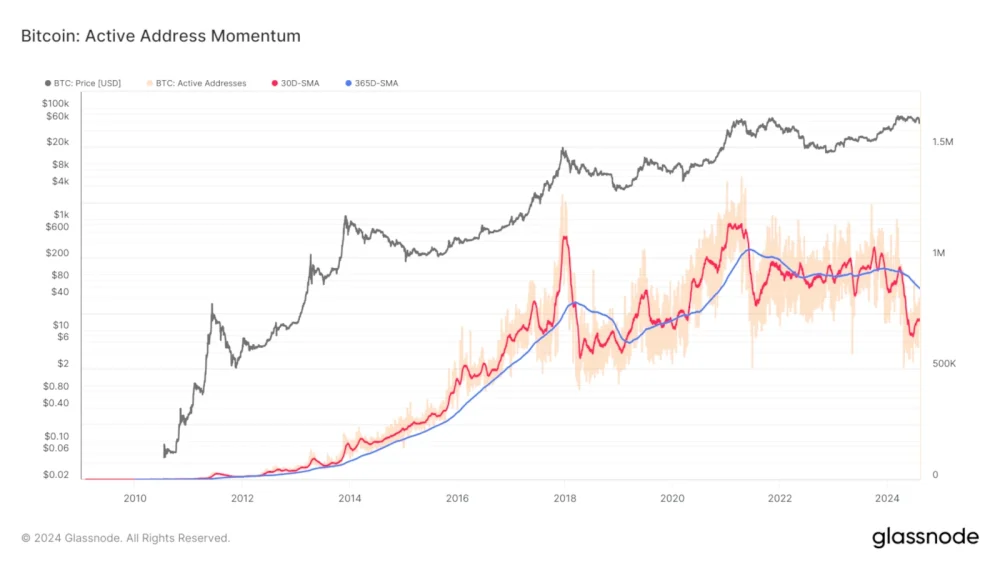
Previous strong bull trends saw strong increases in the 300-SMA and 3650-SMA charts.
At the same time, the number of active addresses increases every cycle.
Of course, this is a testament to ongoing adoption.
True Market Mean
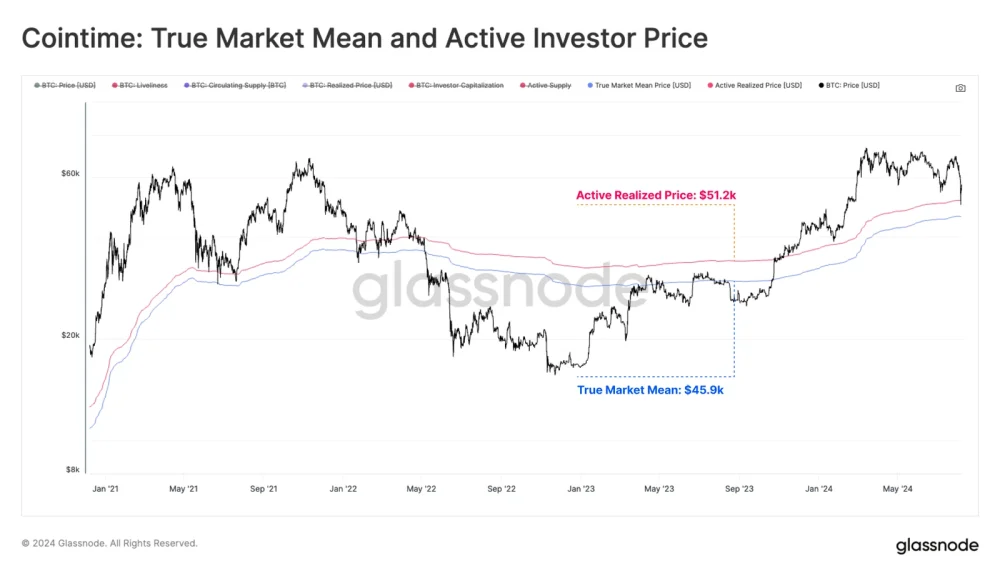
The position of the spot price relative to these two key pricing levels can be considered as zone of interest for differentiating between macro bull and bear markets.
When the price breaks below these two levels, the entire bull market is at risk.
Percent of 21M Supply Mined
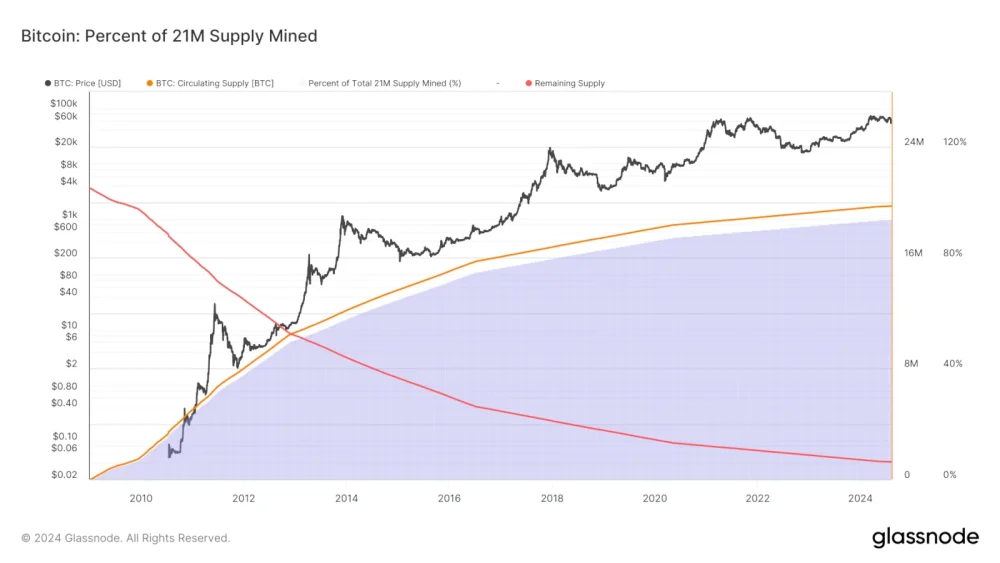
Bitcoin is like a bulletproof vest and I think more and more people realize this.
However, institutional investors certainly know about it.
The price naturally increases according to the available resources, and these are becoming fewer and fewer.
Mayer Multiple
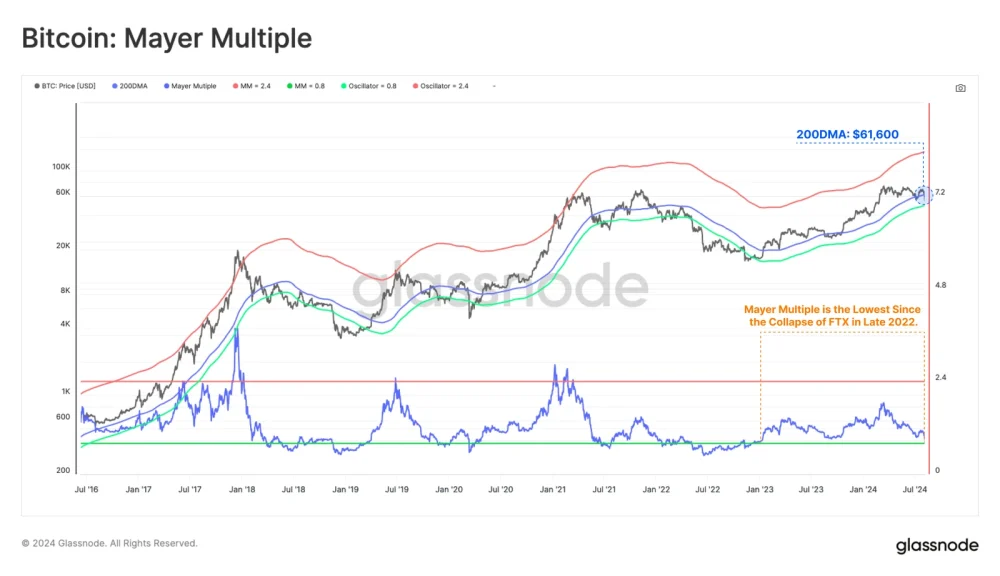
The last time such market losses could be observed was the high-profile bankruptcy of the FTX exchange.
Only 7% of all crypto market days were more severe for investors.
Entry-Adjusted Realized Loss
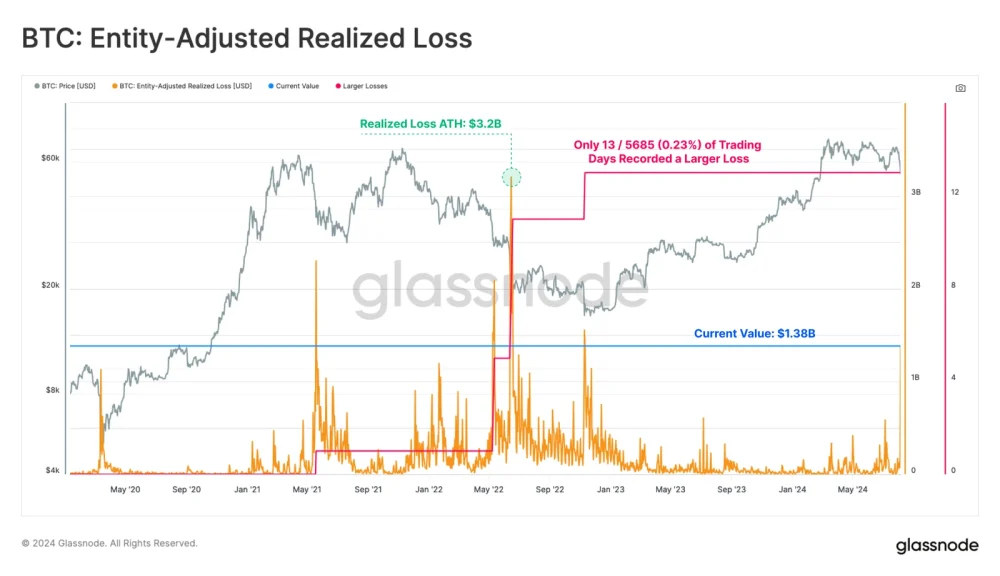
Huge amount of bitcoin losses.
Only 13 times there were major market losses.
All this is due to short positions, i.e. speculative ones.
Which once again emphasizes that playing on the cryptocurrency market usually ends tragically.
Obviously I just presented a few charts among of all. Glassnode studio is very powerful tool for bitcoin analysts or crypto enthusiasts.
Next thing what I would like to write about is where we are at cryptocurrency market right now.
Let’s get straight to the point.
Where we are at Cryptocurrency Market?
I always ask myself whether Glassnode is a good tool that shows where we are in the market and…
While Glassnode is great at showing the state of on-chain data, I cannot clearly state that it is a good tool for determining the state of the cryptocurrency market. Indeed, not for everyone.
Therefore, I will present much less complicated tools that will allow you to more or less assess the state of the cryptocurrency market. Well, let’s go!
Look Into Bitcoin
I can honestly say that this is one of the most intuitive bitcoin data sites.
A large number of charts make the data make more sense. Either way, to fully understand it, you need to do some mental stretching…
Take a look at some charts from Look Into Bitcoin below.
Of course, you will find plenty of bitcoin charts on this site.
Personally, I believe that the simplest ones help me best assess where we are on the market.
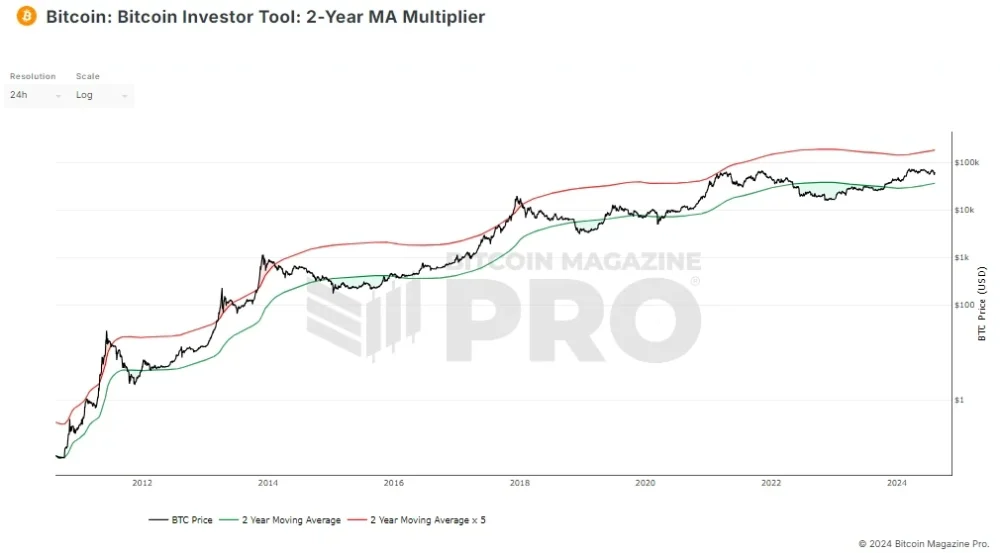
There is no doubt that we are not at the end of the bull market.
In fact, we can even say that we are close to the middle of it or we are slightly beyond the middle of the bull market.
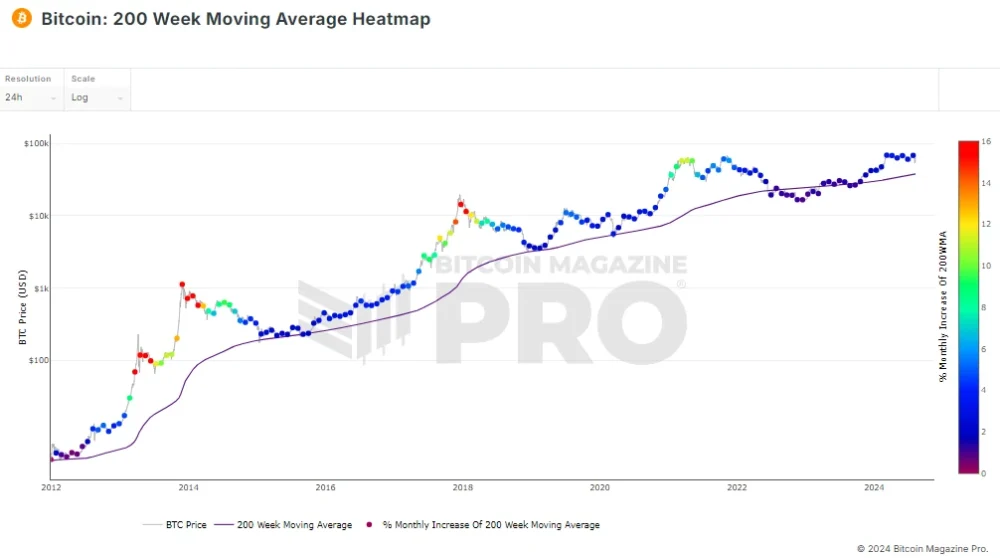
The cold colours on the chart indicate that we are not close to ending the bull market. Moreover, the colour red or yellow has defined the end of this market in previous bull markets.
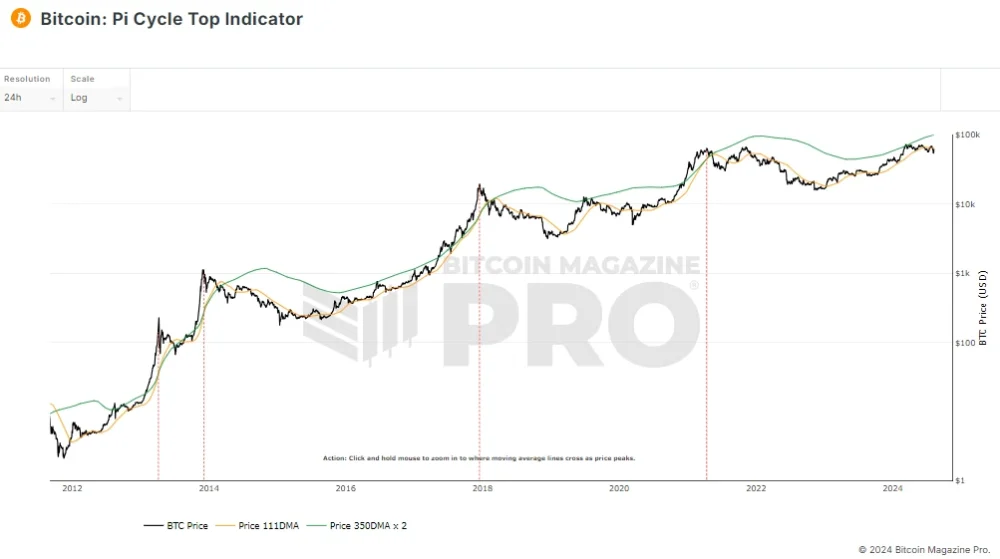
The intersection of two price charts defines the moment just after the peak of a bull market.
Of course, I can’t even talk about it now.
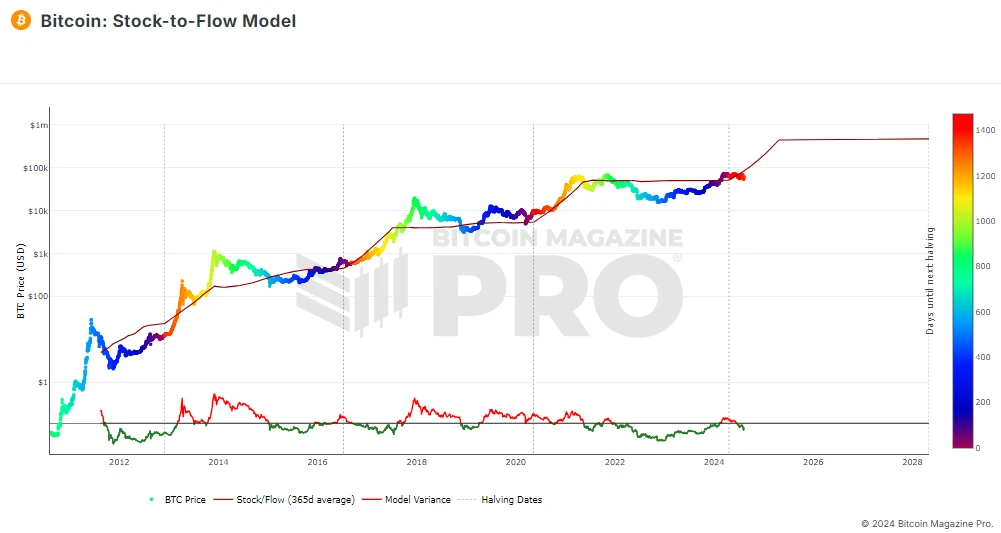
The Stock-to-Flow chart also clearly shows that we are far from the peak of the bull market.
In previous cases, the green color was the time when the price reached its maximum.
CBBI Index
If you need a tool with a specific state and one chart, the CBBI project website is a really interesting option.
Several metrics indicate the final result.
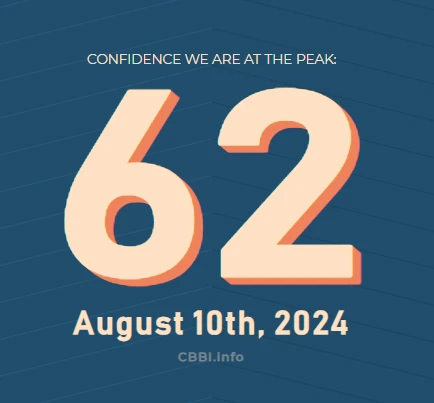
According to the indicator, we are at 62 points.
Suffice it to mention that the previous bull market peaks ended at the level of 98-100!
Index precisely indicated the end of the bull market.
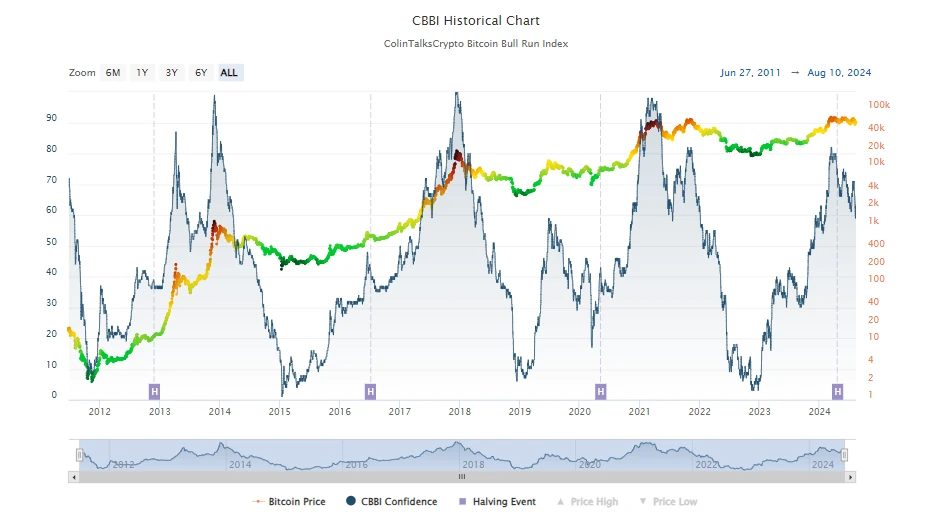
In fact, the colour of black indicated the end of the bull market.
We are not at the end of the bull market yet.
Google Trends
Searching for the phrase Bitcoin perfectly shows how interested the street is in the investment, and this usually indicates the last stages of the bull market.
Unfortunately, this is what happens when investors without experience start investing at the worst possible moment.
Just for fun, I would like to add that the mistake of investing on the “price hill” is also experienced by managers of large investment companies…
This is simply how the human psyche works.
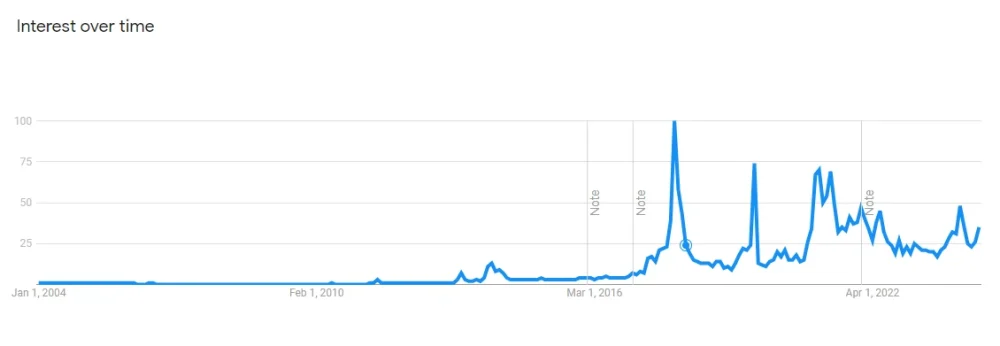
Google Trends only determines searches for a phrase on the Internet, probably by people new to cryptocurrencies.
In 2018, global searches reached 100 for the phrase bitcoin, and in 2021 it was 75.
This indicator is far from precise.
Fear and Greed Index
It is true that this index will not show whether we are at the end of a bull market or in a bear market, but it shows the changing sentiments of investors.
Too much optimism among investors means a correction.
And extreme fear is the local bottom of the market.
Needless to say, this is the best time to invest or go long with leverage.
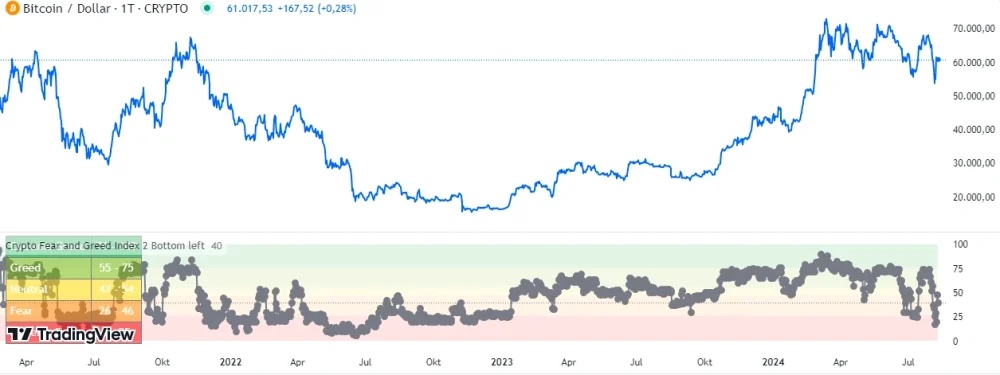
The time of extreme fear also determined the time of the market.
I have already written about it in this article.
Macroeconomic Data
Financial markets like cryptocurrency market are dependent from economic situation on the world.
When on the world is good economy then investors are more likely to invest. In contrary, there are also bad times like recession.
Of course, then investors are far away from financial markets.
One of the best sites you can consider when observing the state of the global economy is tradingeconomics.
Are you interested in the unemployment rate, inflation level or interest rates?
You will find all this and much more information there.
Besides, I have written article about How to predict Bitcoin price what would be helpful.
Conclusions
It’s time to write some conclusions about the presented data and the Glassnode tool itself.
1) Glassnode is a very accurate on-chain analysis tool. Not everyone will enjoy digging through hundreds of charts.
Either way, the tool is great. I would rather direct them to blockchain professionals. This is just my opinion.
2) Look into Bitcoin helps identify bull and bear markets in the cryptocurrency market
3) CBBI index is an independent tool to determine bull market peaks. Of course, not only that.
4) Each of the tools described does not guarantee success.
5) Nothing can replace the human mind and self-assessment of situations. Experience and critical assessment of the situation are irreplaceable.
6) When looking for changes in trend lines, the fear and greed index works very well.
7) Remember to assess your risk and only invest amounts you can afford to lose.
Final Summary
Glassnode is a great tool for on-chain analysis. It is probably one of the best tools of this type on the market. The large number of charts can be overwhelming for beginners. The tool is certainly intended for professionals.
The article only presents charts from the Glassnode studio for bitcoin, but in the meantime you can mine data for Ethereum, DeFi and many others.
There are several tools that are much easier to use and allow us to determine what stage of the cryptocurrency market we are at.

Leave a Reply
You must be logged in to post a comment.